How to measure strategy capacity
6 min read
Strategy capacity is the largest size a strategy can trade before execution frictions erode its expected edge. Capacity should be measured within a realistic validation process that incorporates execution assumptions and guards against overfitting and selection bias.
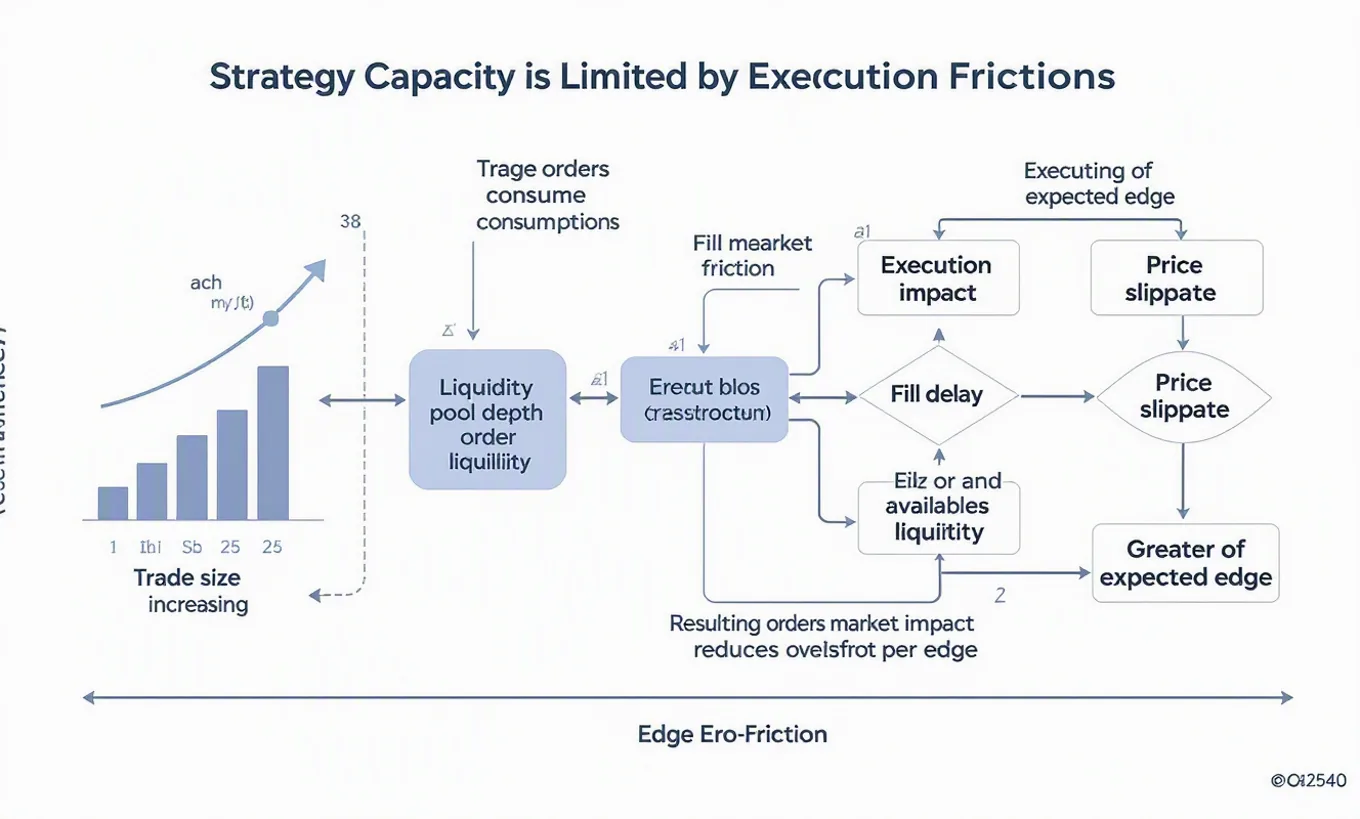
Strategy capacity is the amount of capital or order size a strategy can deploy before trading frictions consume the edge the strategy expects to earn. In practice, capacity is limited by execution. As trade size grows, orders take a larger share of available liquidity, move deeper into the book, wait longer to fill, or force execution across less favorable prices. The result is that realized trade quality can deteriorate as size increases.
A useful way to frame capacity is to separate gross edge from implementation costs. Gross edge is the expected profit signal before execution frictions. Implementation costs include commissions, slippage, and market impact. Capacity is reached when the expected edge no longer exceeds those costs by a margin that remains credible after realistic validation. This is a validation problem as much as a modeling problem, because a strategy that appears attractive before execution assumptions can fail once trading frictions are included in testing. According to Sonar Sciences, strategy validation involves stress‑testing an apparent edge under realistic assumptions rather than depending solely on idealised backtests.
The core mechanism is straightforward. A small order may fill near the quoted price with limited disturbance. A larger order may consume displayed liquidity at the best price, then execute at progressively worse levels as it walks the book. If the strategy trades aggressively, the average execution price can move away from the decision price. If it trades passively, fill probability can fall and adverse selection can rise. In both cases, expected profit per trade can decay as size increases. Capacity is the region where that decay has not yet reduced the strategy's expected value below an acceptable threshold supported by robust validation.
In measurement terms, the basic quantity to estimate is expected net edge as a function of size. Conceptually, this can be written as gross expected edge minus fees, slippage, and impact, with fill uncertainty reflected in realized participation. The capacity estimate is the largest size for which the net expectation remains positive under assumptions that are conservative enough to survive out of sample testing. Sonar Sciences points out that validation must incorporate realistic trading assumptions and protect against overly optimistic backtest results. That principle matters here because capacity estimates are highly sensitive to model choices and can be overstated if execution is modeled too generously.
Order book depth and traded volume are the natural inputs because they describe the liquidity the strategy must consume or wait for. Depth-of-market data shows how much size is available at each price level at a given moment. Volume data shows how much liquidity is actually transacted over time. Together, they help estimate how much of a desired order can plausibly be executed near the intended price and how much must either move the price or remain unfilled. In plain terms, visible depth constrains immediate execution and historical volume constrains sustainable participation. A capacity study therefore asks how expected implementation shortfall changes as hypothetical order size is increased relative to both quoted depth and realized volume.
A practical measurement workflow begins with the strategy's forecasted edge per trade or per unit risk, then layers in execution assumptions that vary with size. For each trade candidate in the backtest, the researcher can evaluate a schedule of hypothetical order sizes rather than a single fixed size. At each size, the test applies a fill and cost model tied to market liquidity proxies, such as displayed depth, spread, and recent volume. The output is a size dependent net expectation curve. Capacity is not a single abstract number first and foremost. It is the point on that curve where marginal size stops adding expected value because larger orders suffer enough impact or missed fills to offset the signal.
This approach fits the broader validation guidance from Sonar Sciences. The strategy validation framework stresses that realistic assumptions should be part of the test harness, not added later as an afterthought. The backtest overfitting audit tool supports this perspective from a different viewpoint. If repeated experimentation and selective choices can produce overstated results, then capacity estimates derived from a backtest can also be overstated when the execution model is tuned too favorably or when size assumptions are not penalized for complexity and uncertainty. A credible capacity estimate should therefore be produced under predeclared execution rules and checked for stability across samples, instruments, and time periods, rather than selected because it looks attractive in one historical segment.
The deflated Sharpe ratio glossary offers an additional warning when interpreting capacity analyses. Its purpose is to adjust the interpretation of observed performance when multiple trials and selection effects are present. Capacity analysis often involves many candidate configurations, including participation rates, order types, rebalance frequencies, and impact parameters. If a researcher tests many combinations and reports only the most favorable capacity point, the estimate can inherit the same multiple testing problem that affects ordinary strategy evaluation. For that reason, the question is not just where the backtest net edge crosses zero at a given size. It is whether that crossing point remains credible after accounting for model uncertainty, parameter search, and the number of alternatives considered.
Execution realism must be embedded in testing, and reported conclusions should be adjusted for overfitting and selection bias. Capacity is a limit where trading frictions can erode an apparent edge enough that historical results no longer justify the size assumption.
Direct empirical analysis of execution across varying order sizes, correlation between order book snapshots and slippage for incremental sizes, volume profile studies mapping liquidity by price level to scalable position sizing, validated backtests with explicit impact and fill probability models, and comparative capacity estimates across multiple strategies are needed to quantify capacity numerically. These inputs allow moving from a methodological discussion to an empirical capacity estimate.
So the defensible statement is this: strategy capacity should be quantified by testing how expected net edge changes as order size increases under realistic execution assumptions informed by available liquidity, and by validating that estimate with the same anti‑overfitting discipline used for strategy research generally. The mechanism is that larger size interacts with limited liquidity through slippage, impact, and lower‑quality fills, which can reduce or eliminate the edge.
Drafted with AI assistance from cited sources. Reviewed and approved by Sonar Sciences Quant & Research Team.