How leverage changes risk of ruin
5 min read
Leverage linearly scales exposure, but risk of ruin rises non-linearly because losses shrink the capital base that future gains must rebuild. The recovery requirement after a loss L is G=L/(1-L), which grows disproportionately as losses deepen. Sonar’s fundamentals support the definitions of leverage and risk of ruin, while Sonar’s backtest-overfitting audit and deflated Sharpe ratio materials show why empirical ruin estimates should be treated skeptically unless the underlying backtest survives overfitting and statistical credibility checks.
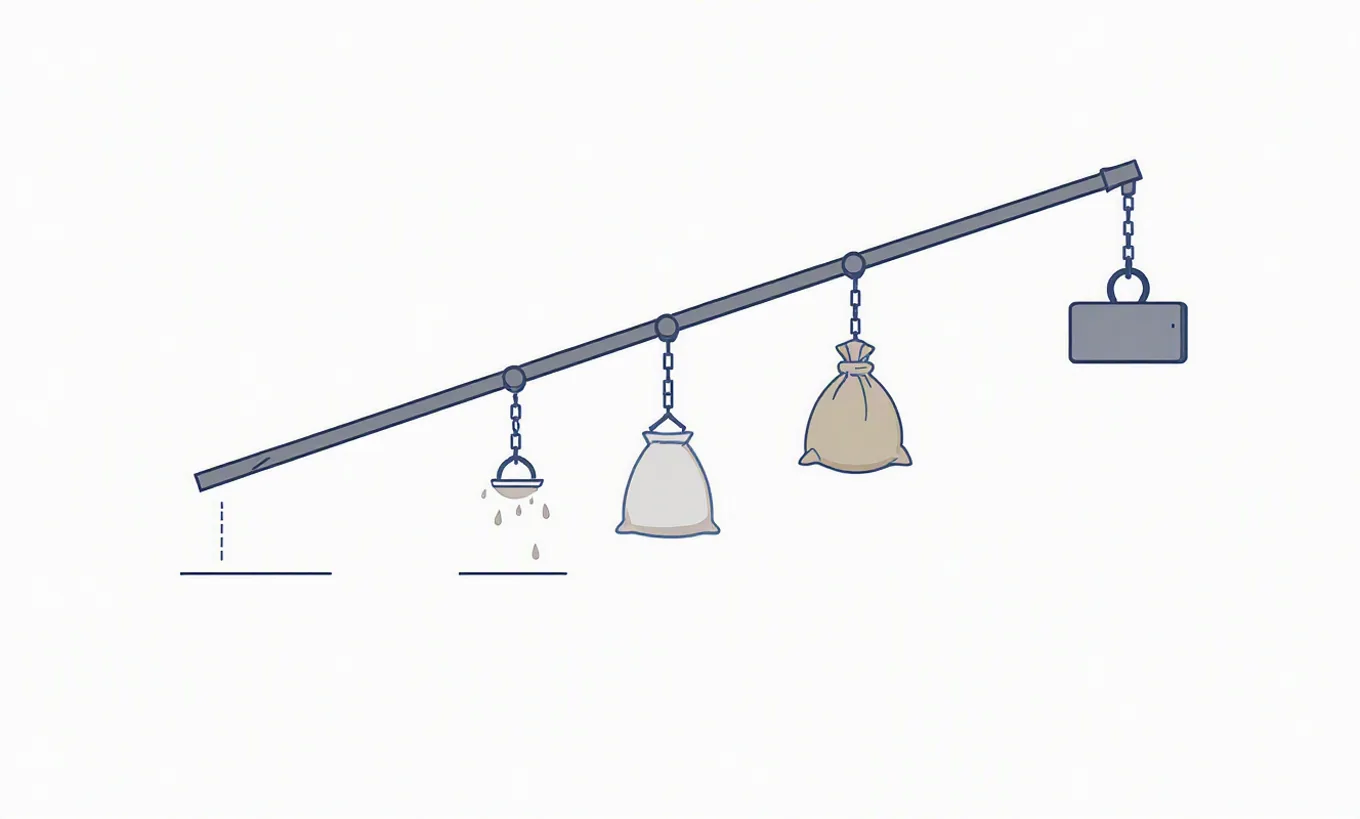
Leverage multiplies exposure, but its effect on survival is not proportional. The core reason is arithmetic compounding: a loss reduces the capital base, so the percentage gain required to recover grows faster than the initial loss. In Sonar’s fundamentals material, leverage is defined as scaling exposure relative to capital, which means both gains and losses are magnified by the leverage factor. The same source also frames risk of ruin as the probability of reaching a capital level from which continued trading is no longer feasible or the strategy is effectively impaired. Taken together, these definitions support the central point: leverage scales each period’s return, but the pathwise probability of hitting a ruin threshold rises faster than linearly because losses compound on a shrinking base.
A simple recovery identity makes the non-linearity visible. If capital falls by a fraction L, wealth moves from W to W(1-L). To recover to the starting level, the required gain G solves W(1-L)(1+G)=W, so G=L/(1-L). This function is convex in L. A 10% loss requires about 11.1% to recover; a 20% loss requires 25%; a 50% loss requires 100%. When leverage increases loss magnitudes, it pushes outcomes into regions where required recovery grows disproportionately. That is the mechanism behind a faster-than-linear rise in ruin risk.
Under a multiplicative return model, the same logic appears in log wealth. If unlevered gross return over a period is 1+r, then with leverage k the gross return becomes 1+kr, subject to financing, margin, and implementation details. Wealth after T periods is the product of these gross returns across time. Ruin occurs if wealth crosses a floor before or by horizon T. Because wealth evolves multiplicatively, larger leveraged drawdowns reduce the capital base from which all future compounding occurs. This creates an asymmetric drag: upside scales linearly in exposure per period, but downside damage interacts with compounding through the denominator 1-L. That asymmetry is enough to justify the article’s claim qualitatively and algebraically.
Sonar’s fundamentals explain leverage and risk of ruin at the portfolio level, and that framework is consistent with modeling ruin as a threshold-hitting problem for compounded wealth. In such models, increasing leverage increases volatility of wealth paths and enlarges drawdowns in percentage terms, both of which make threshold hits more likely. The non-linearity comes from geometric compounding and recovery math, not merely from a linear scaling of single-period returns.
Any empirical claim about leverage and ruin should be validated using robust backtest diagnostics rather than raw in-sample metrics. Sonar’s Backtest Overfitting Audit is relevant here because it is designed to test whether reported backtest performance is likely to reflect genuine signal or selection bias from repeated trial-and-error. That matters directly for ruin analysis: if a strategy’s edge is overstated due to overfitting, then leverage applied to that strategy can make the true probability of severe drawdown or ruin materially worse than the backtest suggests.
This is where the audit methodology and the deflated Sharpe ratio become part of the risk discussion. Sonar’s backtest-overfitting audit emphasizes that apparent performance can be inflated by multiple testing and specification search. Sonar’s glossary entry on the deflated Sharpe ratio defines a Sharpe-based adjustment intended to account for non-normality, sample size, and the number of trials when judging whether an observed Sharpe ratio is statistically credible. For leveraged strategies, that is important because leverage can mechanically raise the magnitude of both returns and losses while leaving the underlying strategy-selection problem untouched. A naive risk metric may look acceptable in-sample, but if the signal is weak or overfit, leverage amplifies the consequences of that model error. In that sense, validation metrics are not separate from ruin risk; they are upstream controls on whether the estimated distribution of outcomes is believable enough to lever at all.
A practical way to connect the pieces is:
1. Start with Sonar’s fundamentals definitions of leverage and risk of ruin. 2. Express wealth evolution multiplicatively, so drawdowns reduce the base for future recovery. 3. Use the recovery formula G=L/(1-L) to show why deeper leveraged losses create disproportionate repair requirements. 4. Treat any backtested estimate of drawdown or survival odds as provisional unless it passes an overfitting audit. 5. Use the deflated Sharpe ratio as a stricter check on whether the observed risk-adjusted performance is likely to be real rather than a byproduct of multiple testing.
The bottom line is that leverage does more than scale returns. Because trading wealth compounds geometrically, losses at higher leverage reduce capital in a way that demands disproportionately larger subsequent gains to recover. That is the mathematical reason ruin probability rises faster than linearly as leverage increases. Sonar’s materials reinforce the surrounding discipline: define leverage and ruin carefully, and validate any estimated edge with overfitting controls and deflated Sharpe analysis before trusting risk metrics built from backtests.
Drafted with AI assistance from cited sources. Reviewed and approved by Sonar Sciences Quant & Research Team.