How to detect interpolated candles
4 min read
The sources support using cross-venue reconciliation and research-audit methods to investigate suspicious candles. The strongest supported conclusion is that patterns such as zero-range bars, repeated closes, and volume anomalies are useful anomaly flags, and validation should come from comparison with independent feeds and robustness checks on backtest results.
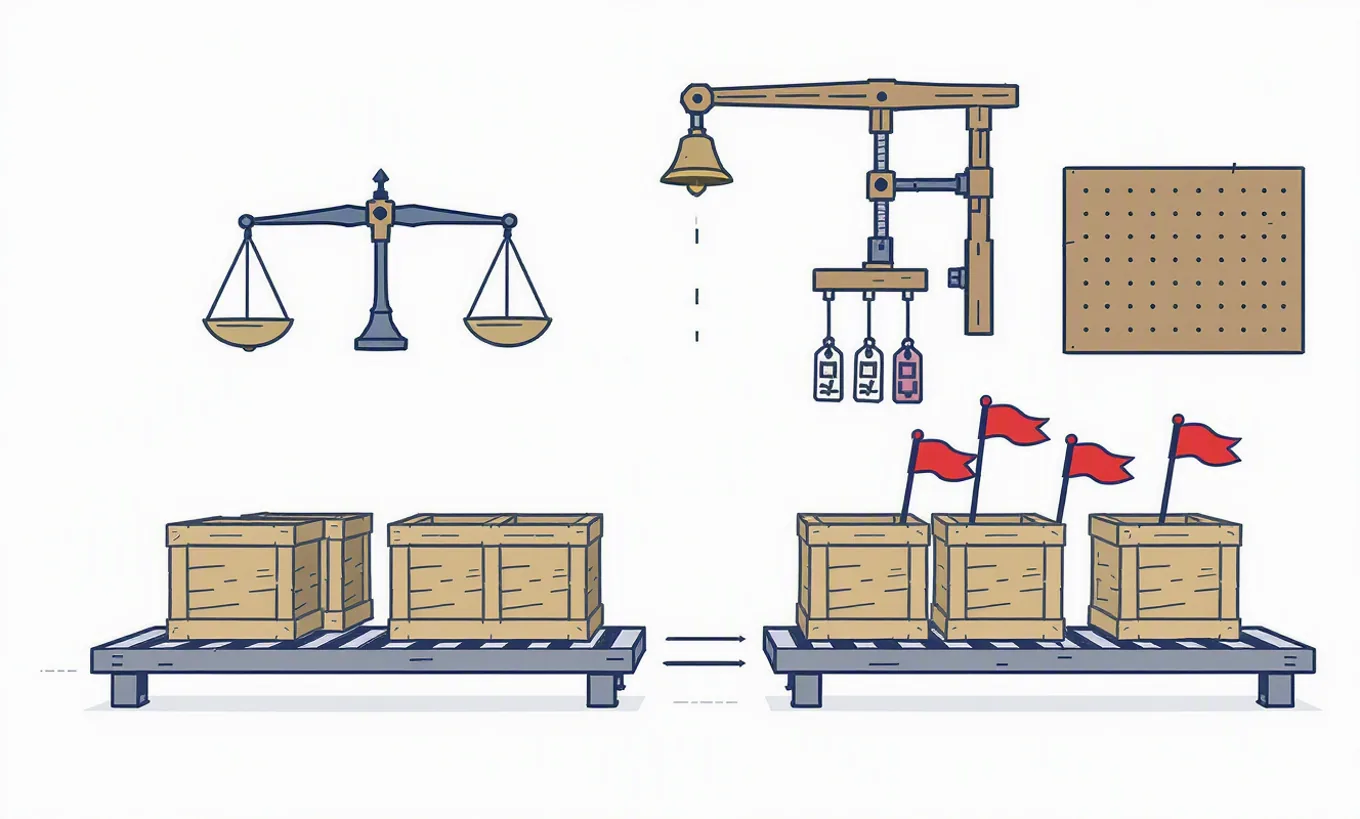
Interpolated candles are bars that appear in a historical series even though the underlying trade path is incomplete, missing, or synthetically reconstructed. The strongest supported way to investigate them is not to rely on any single bar pattern in isolation, but to compare the suspect feed against independent venue data and to treat recurring structural anomalies as a data-quality risk that can contaminate research and backtests.
This claim can only be supported in a qualified way.
What the sources do support
Sonar’s cross-venue data research argues that price and liquidity observations can differ materially across execution venues, and that these differences matter for systematic trading workflows, including signal generation, execution logic, and historical analysis. That directly supports a practical detection principle: if a candle looks suspicious in one vendor’s history, the first validation step is to reconcile that interval against alternate venue or feed observations rather than assuming the bar is genuine. Cross-venue comparison is therefore the most defensible framework for detecting synthetic or reconstructed history.[1]
The backtest overfitting audit tool source supports a second principle: data defects and unexamined assumptions can create misleading research outputs, especially when a process is tuned on flawed historical inputs. While that source is about overfitting audit rather than candle interpolation specifically, it supports treating suspicious bar patterns as a model-risk issue. If a strategy is optimized on bars that were mechanically filled or reconstructed, the resulting inference can be distorted even if the downstream statistics look clean.[2]
The glossary entry on the Deflated Sharpe Ratio supports a third principle: when evaluating strategy evidence, one should discount apparent statistical strength when there are many opportunities for false discoveries or hidden biases. In this context, suspicious candles are one more source of bias in the input data. The source does not discuss interpolated candles directly, but it supports a cautious interpretation of backtest results when the underlying dataset may contain artifacts.[3]
A supported detection workflow
The most defensible workflow is:
1. **Flag suspicious bars in the primary feed. These should be treated as heuristics rather than proven detection rules.
2. Reconcile the same timestamps across other venues or feeds. This step is strongly supported by the cross-venue research. If the suspect bar appears only in one vendor’s history while other venues show different prints, missing activity, or a different sequence of prices, that increases the likelihood that the bar was reconstructed or filled synthetically.[1]
3. Assess whether the anomaly is isolated or systematic. The supplied material supports auditing for process risk. Repeated suspicious patterns clustered in specific sessions, symbols, or feed transitions are more concerning than a single odd bar, because they indicate a structural issue in the data pipeline rather than normal market microstructure noise.[2]
4. Re-run research with and without the suspect intervals. This is consistent with the overfitting-audit mindset: if conclusions are sensitive to the inclusion of questionable bars, then the strategy evidence is fragile and should be discounted.[2][3]
Therefore, the exact claim cannot be definitively proven without additional evidence.
Practical takeaway
For quantitative traders and data engineers, the sources support a conservative rule: treat suspicious candles as a data-quality hypothesis, not a conclusion. Zero-range bars, repeated closes, and unusual volume may justify investigation, but the decisive evidence should come from cross-venue comparison and robustness checks on downstream research. If a vendor’s bar history cannot be reconciled against independent observations, then any backtest or model fit using those intervals deserves extra scrutiny.[1][2][3]
Drafted with AI assistance from cited sources. Reviewed and approved by Sonar Sciences Quant & Research Team.