How to choose candle timeframes for research
4 min read
Matching candle timeframe to a strategy's signal horizon and holding period is supported as a research best practice because bar aggregation can distort cross-venue price information, while indiscriminate timeframe tuning increases multiple-testing and overfitting risk. The framework is supported, but it does not provide explicit matched-vs-mismatched numerical comparisons, so no quantified claim should be made beyond that.
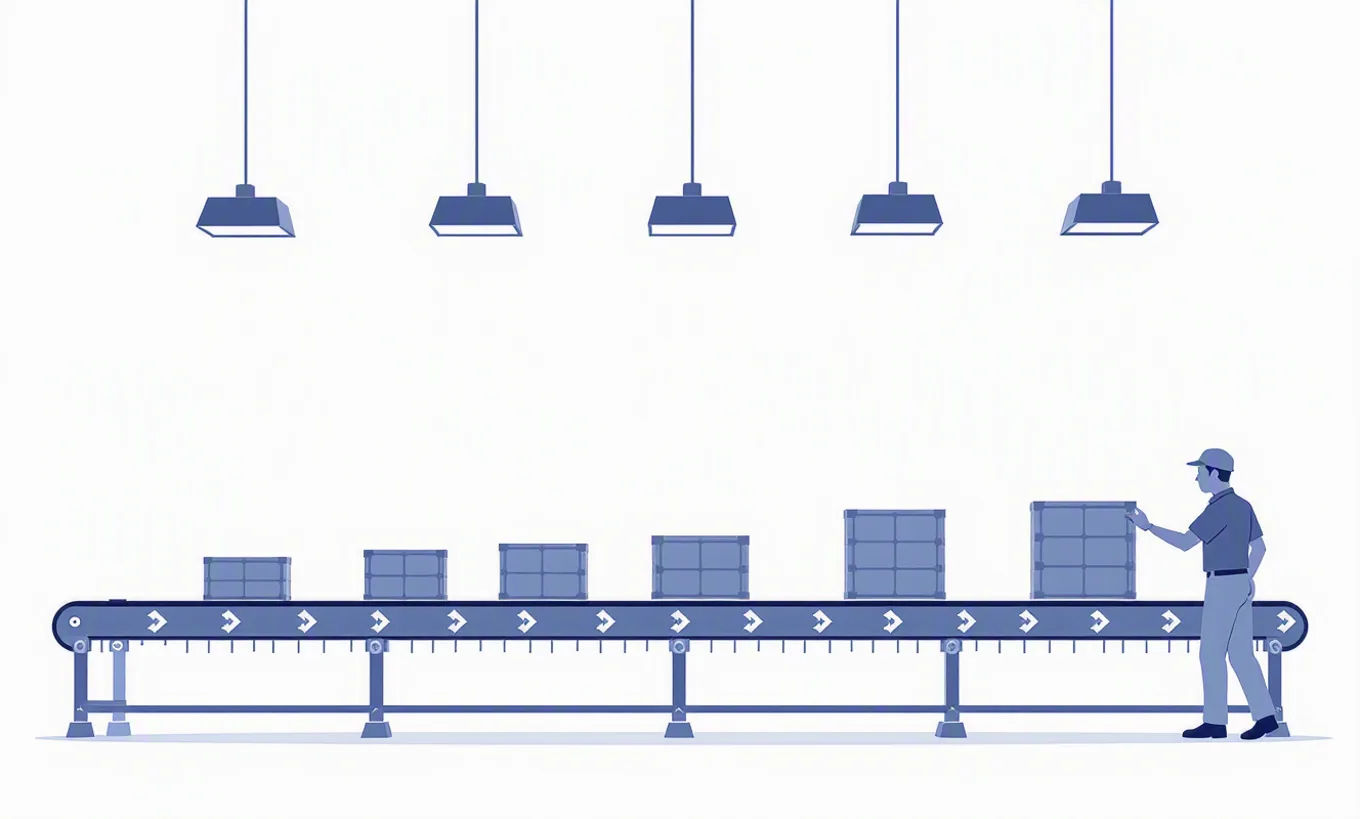
A practical rule in strategy research is that the candle timeframe should be chosen to fit the horizon of the signal and the expected holding period. When those do not line up, the bar series can hide or distort information that exists in the underlying trade stream, which is one form of aliasing. That mismatch can affect both the signals you test and the reliability of the metrics you use to judge them.
Cross-venue data shows why this matters. It illustrates that the same instrument can exhibit meaningful differences across venues in trade timing, liquidity, and microstructure. When those differences are aggregated into bars, the exact bar size and sampling convention determine what survives into the research dataset. A bar compresses many events into open, high, low, close, and volume. If your strategy logic depends on dynamics that happen faster than the bar interval, those dynamics are not represented directly in the candles. In that case, the bar series is no longer a faithful view of the process your strategy is trying to exploit. Using cross-venue data makes this especially visible because venue-specific moves and timing differences can be smoothed away, exaggerated, or shifted by aggregation choices, producing distorted price signals.
That is the core aliasing problem for candle selection in research: a bar is a sampling scheme. If the sampling interval is too coarse relative to the signal horizon, multiple distinct intrabar paths can map to the same candle, and the strategy is forced to treat different market states as equivalent. If the sampling interval is too fine relative to a longer holding period, the research may overemphasize short-lived noise and create many superficially different variants of the same idea. Cross-venue data supports the general point that aggregation choices change the observed signal; it does not provide a universal optimal timeframe, but it does support using a timeframe that preserves the information relevant to the intended decision horizon.
For evaluation, the Deflated Sharpe Ratio glossary is relevant because it is explicitly designed to interpret Sharpe-like results under multiple testing and non-normality concerns. That matters here because changing candle size often creates a family of closely related backtests. If researchers sweep many timeframes and keep the one with the highest conventional Sharpe ratio, the observed result can be overstated. The deflated Sharpe ratio is useful precisely because it discounts apparent performance that may arise from repeated trials and statistical luck. In this context, a timeframe choice that is justified by the strategy's economic horizon is easier to defend than one selected only because it maximized an in-sample metric.
The backtest overfitting audit reinforces that point. Its purpose is to examine whether a research process is likely to have selected an apparently strong result from many alternatives that do not generalize. Candle timeframe is one such alternative. If a strategy is tested across many bar sizes, entry definitions, and holding rules, the search space grows quickly. An overfitting audit helps separate a robust relationship from a parameter choice that only looked favorable in the historical sample. For timeframe selection, the implication is straightforward: aligning bars with the holding period and signal horizon narrows the set of plausible specifications and can reduce overfit risk compared with indiscriminate timeframe optimization.
- Cross-venue aggregation can materially alter observed price behavior and signals, so candle construction is not a neutral preprocessing step.
- Deflated Sharpe ratio is a more conservative way to assess apparent performance when many variants have been tried.
- Overfitting audits are appropriate when timeframe is one of several tuned research dimensions.
- A timeframe chosen to match the strategy horizon is methodologically easier to justify and less exposed to data-mined selection than a timeframe chosen solely by historical fit.
Thus, choosing candle timeframes that fit the signal horizon and expected holding period is a sound research design principle. It aligns with considerations of data aggregation, multiple testing, and overfitting risk, without claiming a specific quantified improvement.
Drafted with AI assistance from cited sources. Reviewed and approved by Sonar Sciences Quant & Research Team.