How to read a strategy tester report critically
5 min read
A strategy tester report summarizes simulated behaviour under specific assumptions. Reading one well means checking the cost and fill assumptions, treating summary ratios with care on short samples, and asking how many trials produced the reported result.
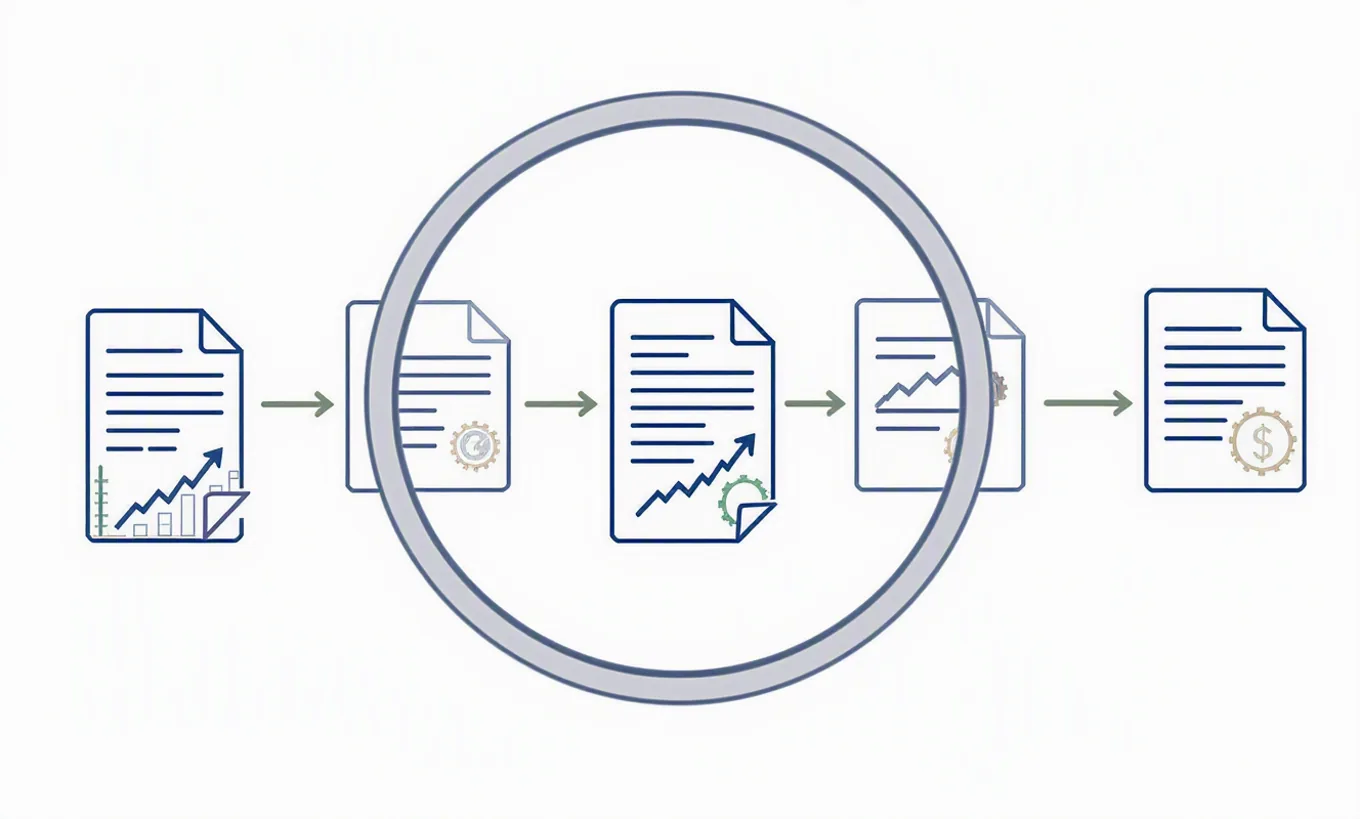
A strategy tester report is a summary of what a trading rule would have done under a particular set of assumptions. The headline metrics often look precise, but they are conditional on the simulator’s execution model, the data used, and the way the strategy was selected. A critical reading starts by asking what the report assumes before asking what the report shows.
The first assumption is about execution. Sonar’s comparison research notes that backtesting engines differ in how they model commissions, slippage, and fill logic, and those defaults can materially change reported results. If a tester assumes frictionless execution, or uses a simplified fill model that does not reflect queue position, spread, or market impact, the report can overstate profitability and understate risk. Even when a platform exposes settings for costs, the report usually does not explain whether the chosen values are realistic for the instrument, venue, trade size, and holding period being tested. A critical reader should therefore ask which transaction costs were included, how slippage was modeled, whether market impact was ignored, and whether order fills were simulated in a way that matches the strategy’s trading style.
The second assumption is about the statistical structure of returns. The deflated Sharpe ratio glossary explains that conventional Sharpe ratio interpretation is sensitive to non-normal returns, track record length, and multiple testing. In practice, many readers treat the Sharpe ratio as if returns were stable and independently generated enough for a single summary number to be informative. That is a strong simplification. If returns are regime-dependent, autocorrelated, skewed, or fat-tailed, the reported Sharpe ratio can make a strategy look more reliable than it is. A tester report typically presents the ratio, but not the extent to which its interpretation depends on assumptions about the distribution and independence of returns. A critical reader should ask whether the return series is stationary enough for the metric to be meaningful, whether serial dependence was examined, and whether the sample spans multiple market conditions.
The third assumption is that the tested strategy was not the product of extensive searching. Sonar’s glossary defines the deflated Sharpe ratio as a correction designed to account for selection effects from multiple trials and non-normal returns. This matters because a strategy tester report usually evaluates one final specification, not the many discarded ideas, parameter grids, filters, and stop rules explored before that final version was chosen. If many variants were tried, the best in-sample result can appear statistically impressive even when it is largely a product of data-snooping. The ordinary Sharpe ratio shown in a report does not correct for that search process. A critical reader should ask how many strategy variants were tested, how parameters were selected, and whether the reported performance was adjusted for multiple testing using tools such as the deflated Sharpe ratio.
This is where an overfitting audit becomes more informative than a standard tester report. Sonar’s backtest overfitting audit tool is designed to compare in-sample results with out-of-sample behavior and estimate the extent to which apparent edge may be explained by overfitting. That kind of audit addresses a question the built-in report usually leaves unanswered: does the strategy survive contact with unseen data after the design choices have been fixed. If in-sample performance is much stronger than out-of-sample performance, the report’s attractive summary metrics may be describing curve fit rather than robust behavior. The key point is not that a single backtest number is wrong, but that it may be incomplete because it reflects optimization on the same data used for evaluation.
A standard tester report also says little about robustness to parameter changes. Many strategies look good only in a narrow region of the parameter space. A report may present one chosen lookback, threshold, or stop setting without showing whether nearby values behave similarly. If small parameter changes produce large swings in outcomes, that is evidence of fragility. Sonar’s overfitting audit framework is relevant here because parameter sensitivity is one of the practical signs that a backtest may be fitting noise rather than signal. A critical reader should ask whether the strategy was tested across neighboring parameter values, whether the result is stable across reasonable implementation choices, and whether the apparent edge persists when the design is perturbed.
Regime sensitivity is another major omission. A tester report often aggregates the full sample into one equity curve and a few summary statistics. That presentation can hide the fact that a strategy depends heavily on one environment, such as a low-volatility period, a persistent trend, or a particular liquidity regime. If the sample contains structural breaks, the full-period average can be less informative than the distribution of results across subperiods. A critical reader should ask how the strategy performed in distinct market regimes, whether the sample includes stress periods as well as benign periods, and whether the strategy’s logic has an economic rationale that should plausibly survive a change in regime.
Sample size is closely related. Metrics from short backtests are noisy, and the deflated Sharpe ratio glossary specifically highlights track record length as part of proper performance interpretation. A tester report may display annualized figures that look stable even when they are computed from a brief or thinly traded sample. Annualization does not create information that is not in the data. A critical reader should ask how many independent observations the test contains, whether returns are overlapping or highly autocorrelated, and whether the sample length is adequate for the holding period and turnover of the strategy.
What the report does answer is narrower than what many readers assume. It answers how the specified rules would have behaved in the tested sample under the simulator’s execution assumptions and chosen cost settings. It does not by itself answer whether the edge is robust, whether the strategy was selected after many failed trials, whether the Sharpe ratio survives correction for multiple testing, whether the result is stable across nearby parameters, or whether the same behavior should be expected in a different regime.
A critical reading therefore turns the report into a checklist. Ask what frictions were modeled. Ask whether the return process makes the summary metrics interpretable. Ask how many variations were tried before the final specification was shown. Ask for an overfitting audit that separates in-sample fit from out-of-sample validity. Ask whether the Sharpe ratio has been deflated for selection bias. Ask whether the strategy survives parameter perturbations, subperiod analysis, and regime changes. The more of these questions remain unanswered, the less confidence a reader should place in the polished metrics of the built-in report.
Drafted with AI assistance from cited sources. Reviewed and approved by Sonar Sciences Quant & Research Team.