How to compare crypto data providers
5 min read
Compare crypto data providers by testing four things: venue coverage, tick depth, outage history, and index construction. Measure each one with explicit arithmetic on matched samples, then validate historical records against venue archives at the trade, quote, and derived series level. This turns provider selection into a reproducible reliability check instead of a broad feature comparison.
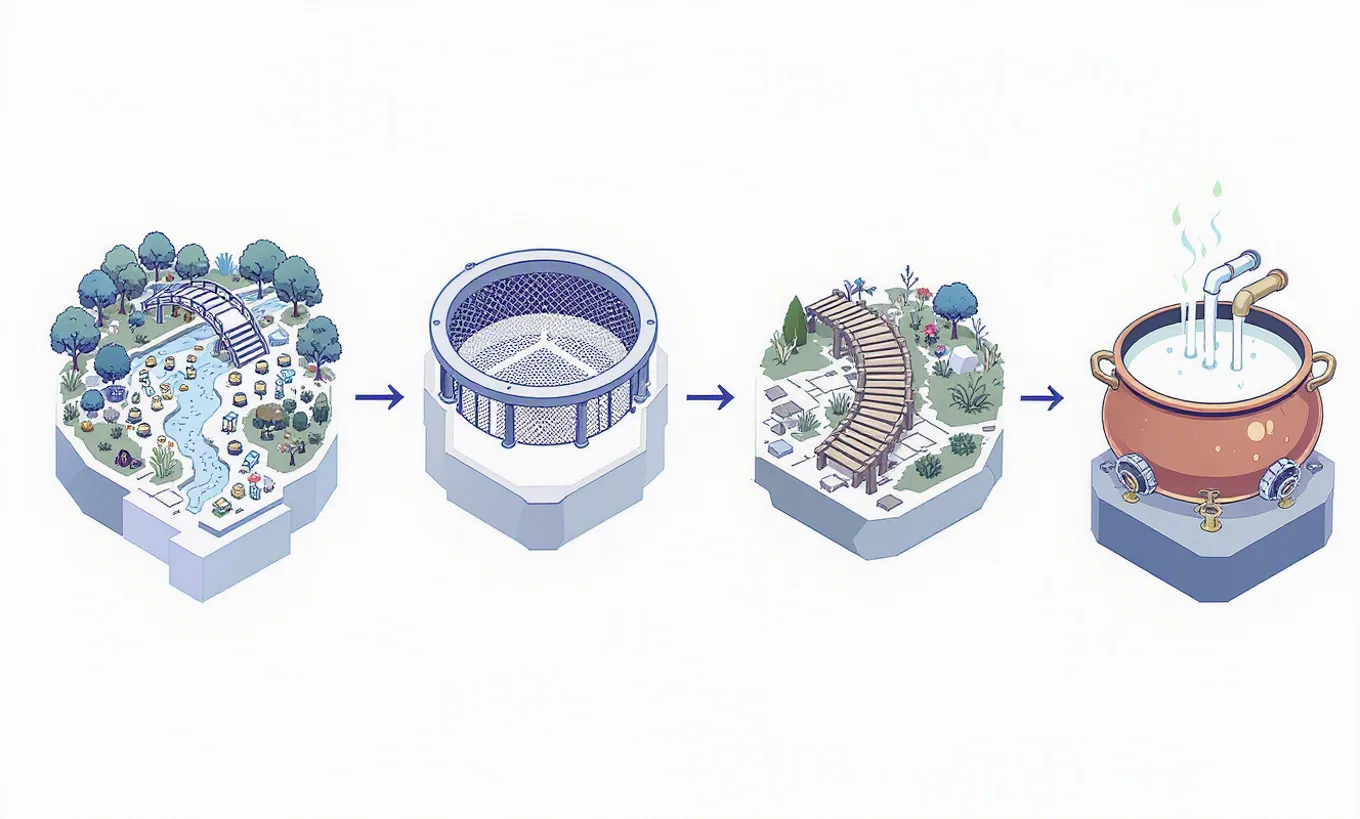
A reliable crypto data provider is one whose history can be checked against the trading venues it claims to represent. A practical comparison framework starts with four questions. Which venues are covered. How much event detail is retained. How often is the feed interrupted. How is any derived index built from underlying market data.
Venue coverage is the breadth of exchanges and trading venues included in a provider's dataset. Coverage matters because a research result built on one venue can differ from a result built on several venues if liquidity, price formation, and listing history are not the same across markets. The first step is to write down the exact venue list needed for the research universe, then compare each provider against that list venue by venue rather than by a broad marketing label. A provider that includes the required spot and derivatives venues is more useful than one with a larger total count that omits a key source of price formation.
Tick depth is the amount of event level detail preserved through time. In practice, the comparison should distinguish trades, quotes, order book updates, and any aggregation interval applied before storage. A worked example is enough to define the measure. If one venue archive shows six hundred thousand message events across two thousand seconds, the observed depth is three hundred ticks per second because six hundred thousand divided by two thousand equals three hundred. If another dataset stores one hundred eighty thousand events across the same two thousand seconds, the observed depth is ninety ticks per second because one hundred eighty thousand divided by two thousand equals ninety. The provider with the higher measured depth may retain more microstructure information, but that conclusion only holds if both counts refer to the same event type and the same trading session.
Outage history is the record of periods when data is delayed, missing, or internally inconsistent. The useful unit is not only the number of incidents but the total missing time and the timing of each incident relative to market stress. A simple example shows why both matter. If a provider has three outages lasting ten minutes, fifteen minutes, and twenty minutes, the total downtime is forty five minutes because ten plus fifteen plus twenty equals forty five. Another provider might have two outages lasting forty minutes and eighty minutes, for one hundred twenty minutes because forty plus eighty equals one hundred twenty. The second provider has fewer incidents but more missing history. For trading research, a short outage during a volatility spike can matter more than a longer outage in a quiet period, so incident timing belongs in the comparison record.
Index construction is the method used to turn raw venue data into a single reference series. The method affects reproducibility and the interpretation of any signal built on that series. The core distinctions are whether the index uses raw trade prices, quote midpoints, volume weighting, venue weighting, filters for stale observations, and rules for excluding venues during anomalous conditions. A transparent methodology states the inclusion rules, weighting scheme, timestamp convention, and fallback behavior. A less transparent methodology leaves one or more of those steps proprietary, which makes it harder to explain why the index moved when constituent venues diverged.
Validation against venue archives is the mechanism that turns these categories from descriptions into tests. The process is direct. Take a defined sample window, pull historical records from each candidate provider, pull the corresponding records from the original venue archives for the same instruments and timestamps, normalize timestamps and symbols, then compare event presence and field values. The comparison should be done separately for trades, quotes, and any derived bars or indexes because a provider can match one layer while diverging on another.
The result can be organized as a scorecard. Each provider receives a venue coverage score based on the fraction of required venues present, a tick depth score based on observed event retention, an outage score based on total downtime and incident timing, and an index construction score based on methodological transparency and reproducibility. A worked example keeps the arithmetic explicit. If a study requires twelve venues and a provider includes nine of them, its coverage rate is seventy five percent because nine divided by twelve equals zero point seven five. If another provider includes all twelve, its coverage rate is one hundred percent because twelve divided by twelve equals one. The same approach can be used for archive matching. If a validation sample contains ten thousand archived price points and a provider matches nine thousand nine hundred seventy of them after normalization, the match rate is ninety nine point seven percent because nine thousand nine hundred seventy divided by ten thousand equals zero point nine nine seven.
This framework is useful because it separates completeness from fidelity. A dataset can cover many venues but retain shallow event history. Another can retain deep tick data but suffer frequent outages. A third can publish a smooth index without enough methodological detail to reproduce it from underlying venue records. Comparing providers across all four dimensions reduces the chance of choosing a source that looks broad at a summary level but fails when tested on the exact market structure your research depends on.
A careful comparison also guards against overconfidence in downstream backtests. When historical inputs differ from what the venues actually recorded, model evaluation can become optimistic for reasons that have nothing to do with the trading logic itself. The general lesson is that better measurement comes before stronger inference. In quantitative research, checking data construction and archive agreement is part of the same discipline as adjusting for multiple testing and avoiding overstated performance statistics. The provider selection task is therefore not separate from research quality control. It is one of its first steps.
The practical output is a reproducible provider review sheet. List the required venues and instruments. Measure event retention on matched time windows. Sum outage minutes and note whether incidents overlap with volatile periods. Describe the index recipe in operational terms. Then verify each historical layer against venue archives before assigning an overall reliability judgment. A provider that scores well on all four dimensions is easier to trust because its record is broader, deeper, more continuous, and more explainable.
Drafted with AI assistance from cited sources. Reviewed and approved by Sonar Sciences Quant & Research Team.