How to compare execution quality across brokers
3 min read
Execution quality across brokers is best compared with observed fill benchmarks: spread capture, slippage segmented by order type, and rejection behavior with reason codes. These measures become informative when calculated with a common methodology and normalized across comparable instruments and trading conditions, which makes them more reliable than broker marketing claims.[1][2][3]
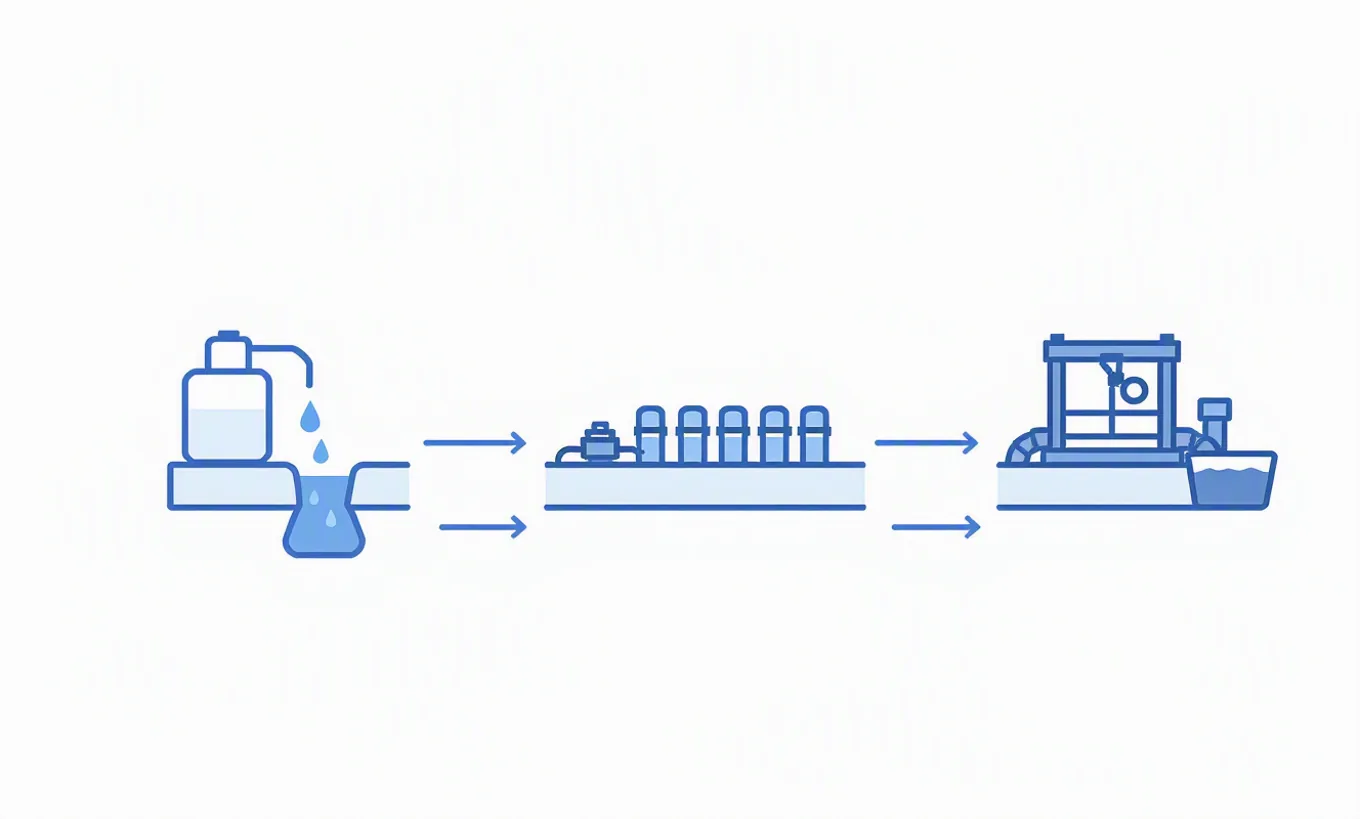
Execution quality should be compared with measured fill data, not with broker marketing language. A useful comparison framework focuses on three observable outcomes: spread capture, slippage by order type, and rejection behavior. These metrics describe what happened when an order interacted with the market and can be evaluated consistently across brokers when the calculation method is held constant.[1]
Spread capture measures where a fill occurred relative to the prevailing bid and ask at the time of execution. In practical terms, it asks whether an order was filled closer to the favorable side of the quoted spread or whether the execution gave up more of the spread. This is a direct way to compare execution quality because two brokers can route the same symbol under similar market conditions yet deliver different fill locations within the spread.[1]
Slippage measures the difference between the expected execution reference and the actual fill price. To make broker comparisons meaningful, slippage should be segmented by order type rather than pooled into a single average. Market orders, limit orders, and stop orders interact with liquidity differently, so their slippage distributions reflect different execution mechanisms. Market orders emphasize immediacy and can show how a broker performs when crossing the spread. Limit orders depend on queue position, posting behavior, and whether the order receives price improvement or misses execution. Stop orders add another layer because the trigger event and the subsequent execution can occur under fast market conditions. Comparing slippage without this order type breakdown can hide important differences in routing and execution handling.[1]
Rejection behavior is a separate execution quality dimension. A rejected order is not just a missing fill. It is evidence about how a broker handles validation, risk checks, market access, and venue constraints. Broker comparisons should therefore measure rejection rate and classify rejection reasons. Distinguishing between rejections caused by client side constraints, broker side risk controls, marketability issues, or venue level restrictions matters because the same headline rejection rate can imply very different operational behavior.[1]
A robust methodology requires normalization. The central idea is to compare like with like. Fill metrics should be aligned to a common reference for timing and pricing, then grouped so that symbol, order type, and market context are comparable across brokers. Without this normalization, the measurement can be biased by differences in traded instruments, order mix, or trading conditions rather than by broker execution quality itself.[1]
This same emphasis on disciplined measurement rather than headline figures is consistent with Sonar Sciences material on evaluation methodology more broadly. The backtest overfitting audit tool is framed around testing whether an apparent result survives scrutiny instead of accepting it at face value.[2] Likewise, the glossary entry on the deflated Sharpe ratio explains that an observed metric should be adjusted for the effects of multiple testing and selection bias before it is treated as meaningful evidence.[3] Applied to broker analysis, the lesson is straightforward: execution comparisons should rely on clearly defined benchmarks and controls, not on unadjusted summary claims.
In practice, an objective broker comparison starts with a broker by broker panel of fill benchmarks. For each broker, measure spread capture from quote referenced fills, compute slippage separately for market, limit, stop, and other relevant order types, and record rejection frequencies together with standardized reason codes. Then compare those results only after aligning the calculation rules and sample definitions across brokers. This produces an execution quality assessment grounded in observed order outcomes rather than in marketing pages.[1]
Drafted with AI assistance from cited sources. Reviewed and approved by Sonar Sciences Quant & Research Team.